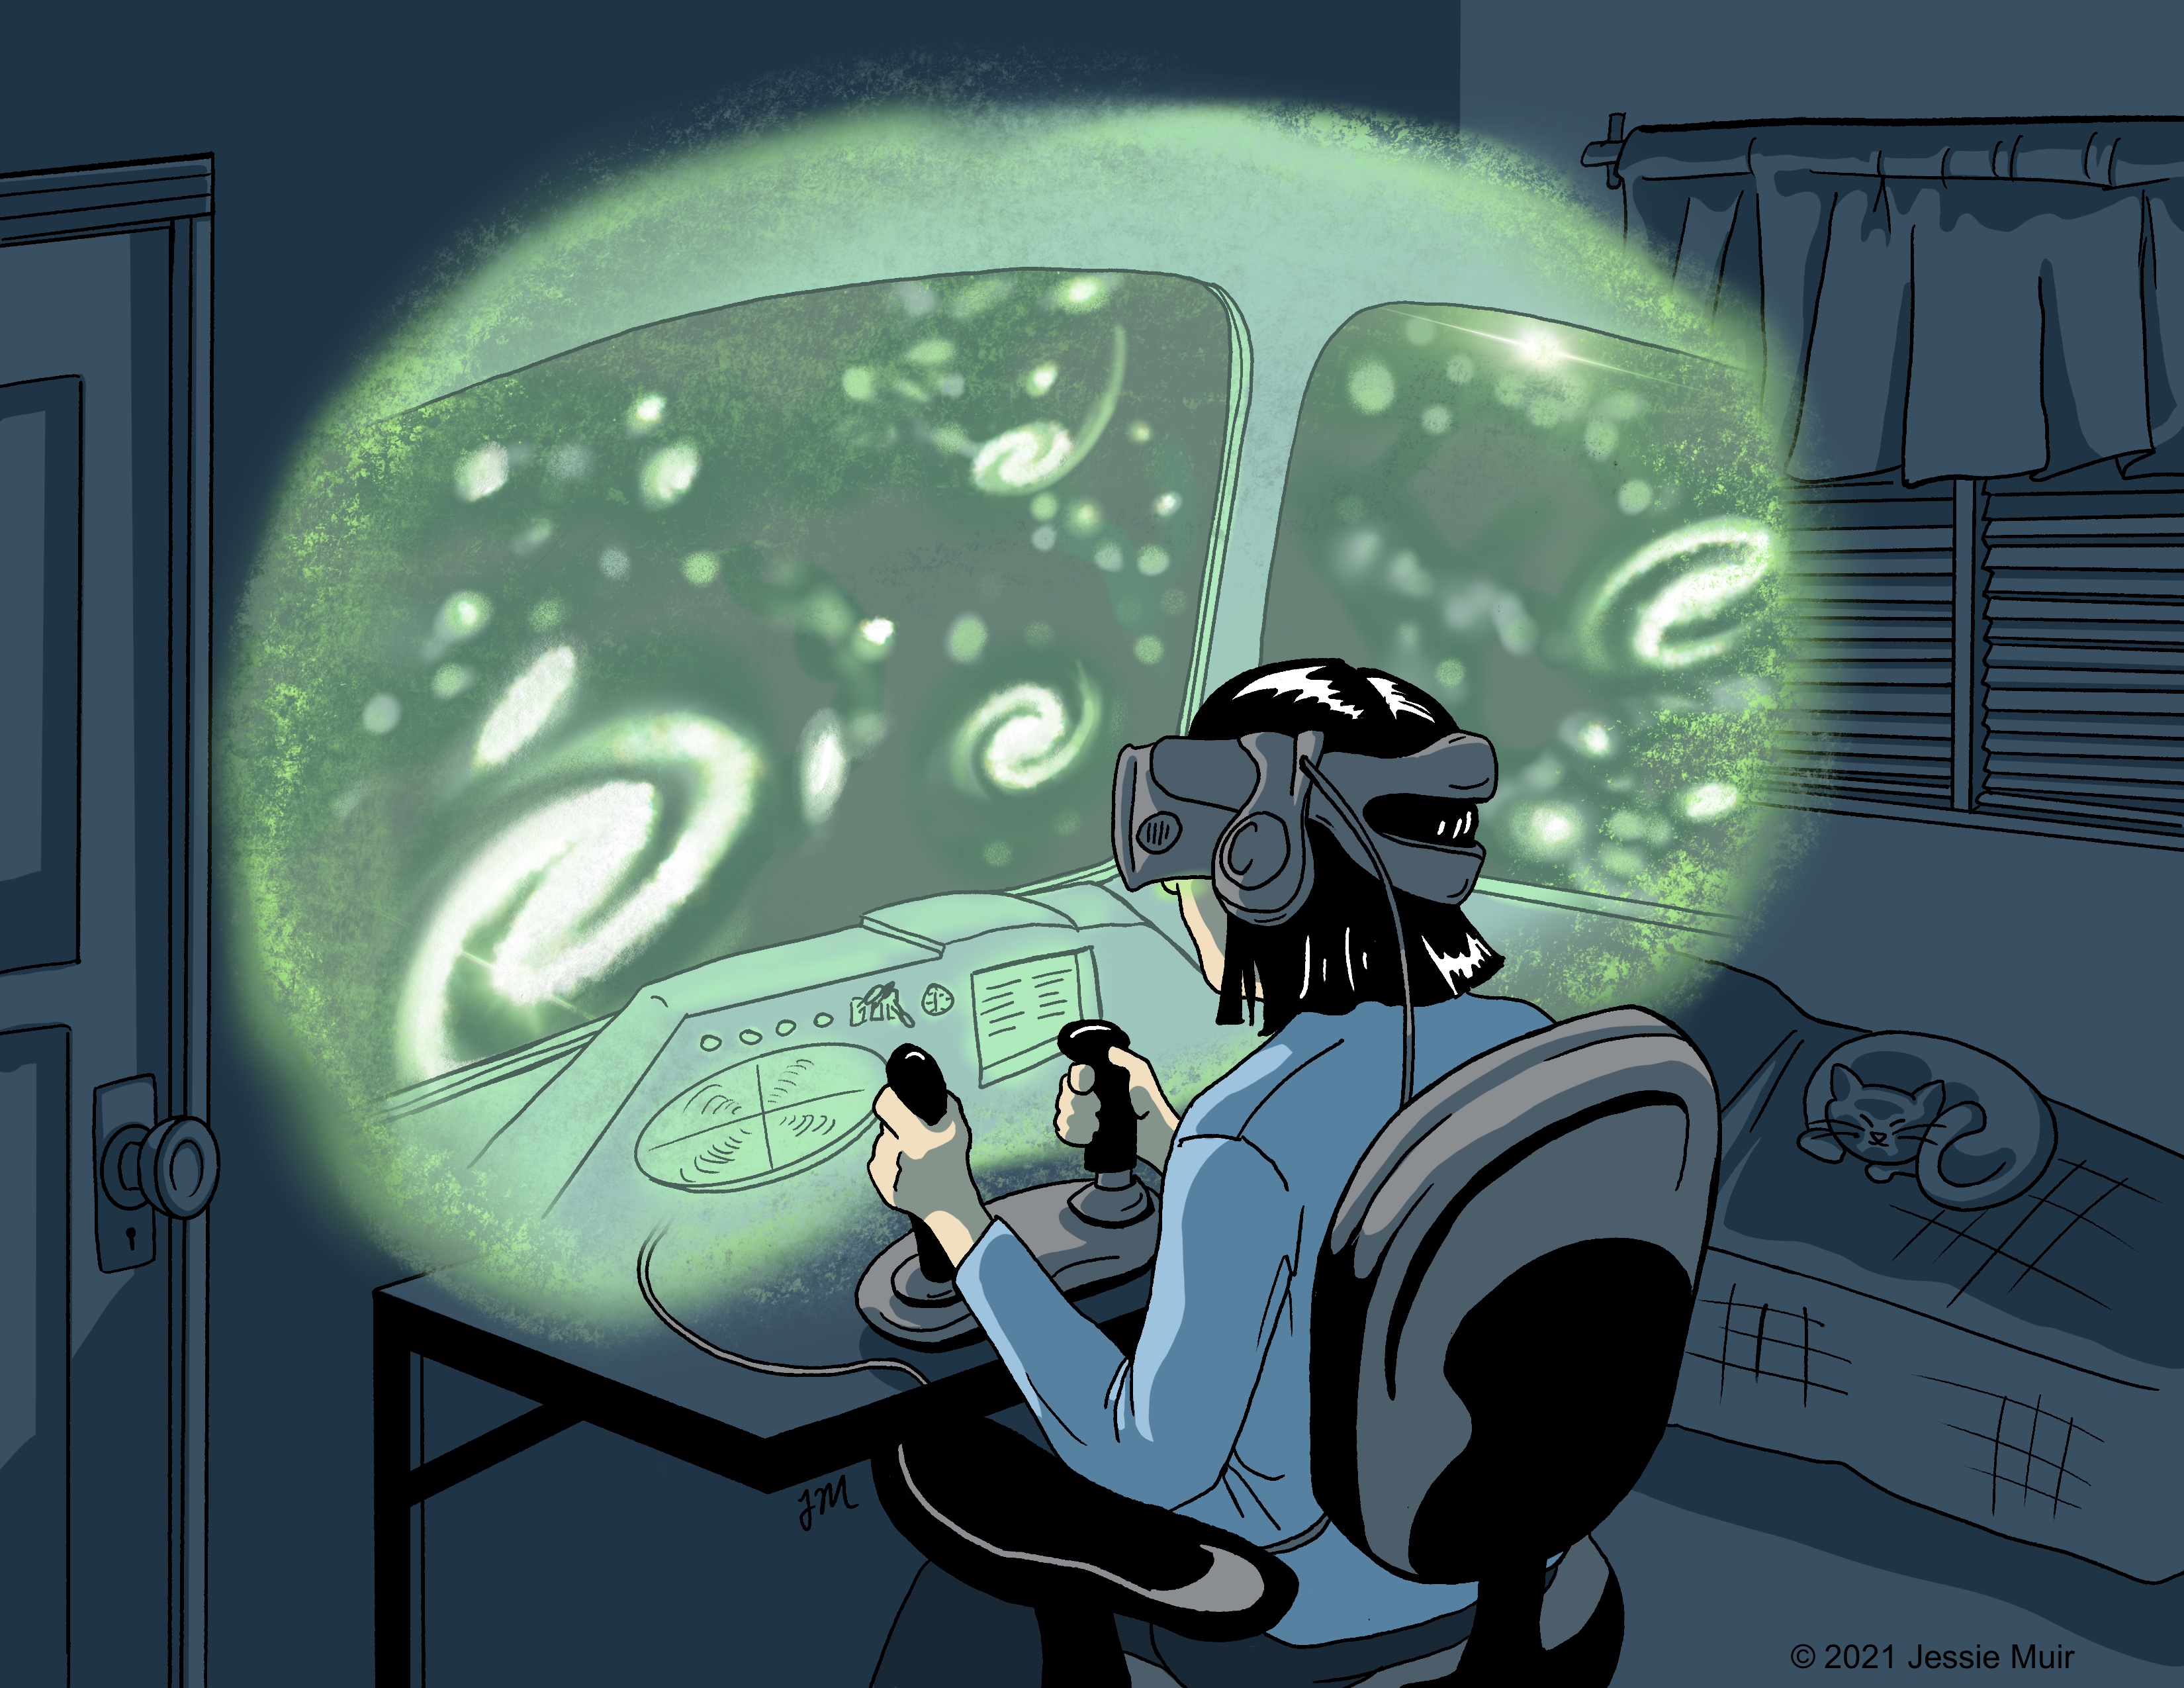
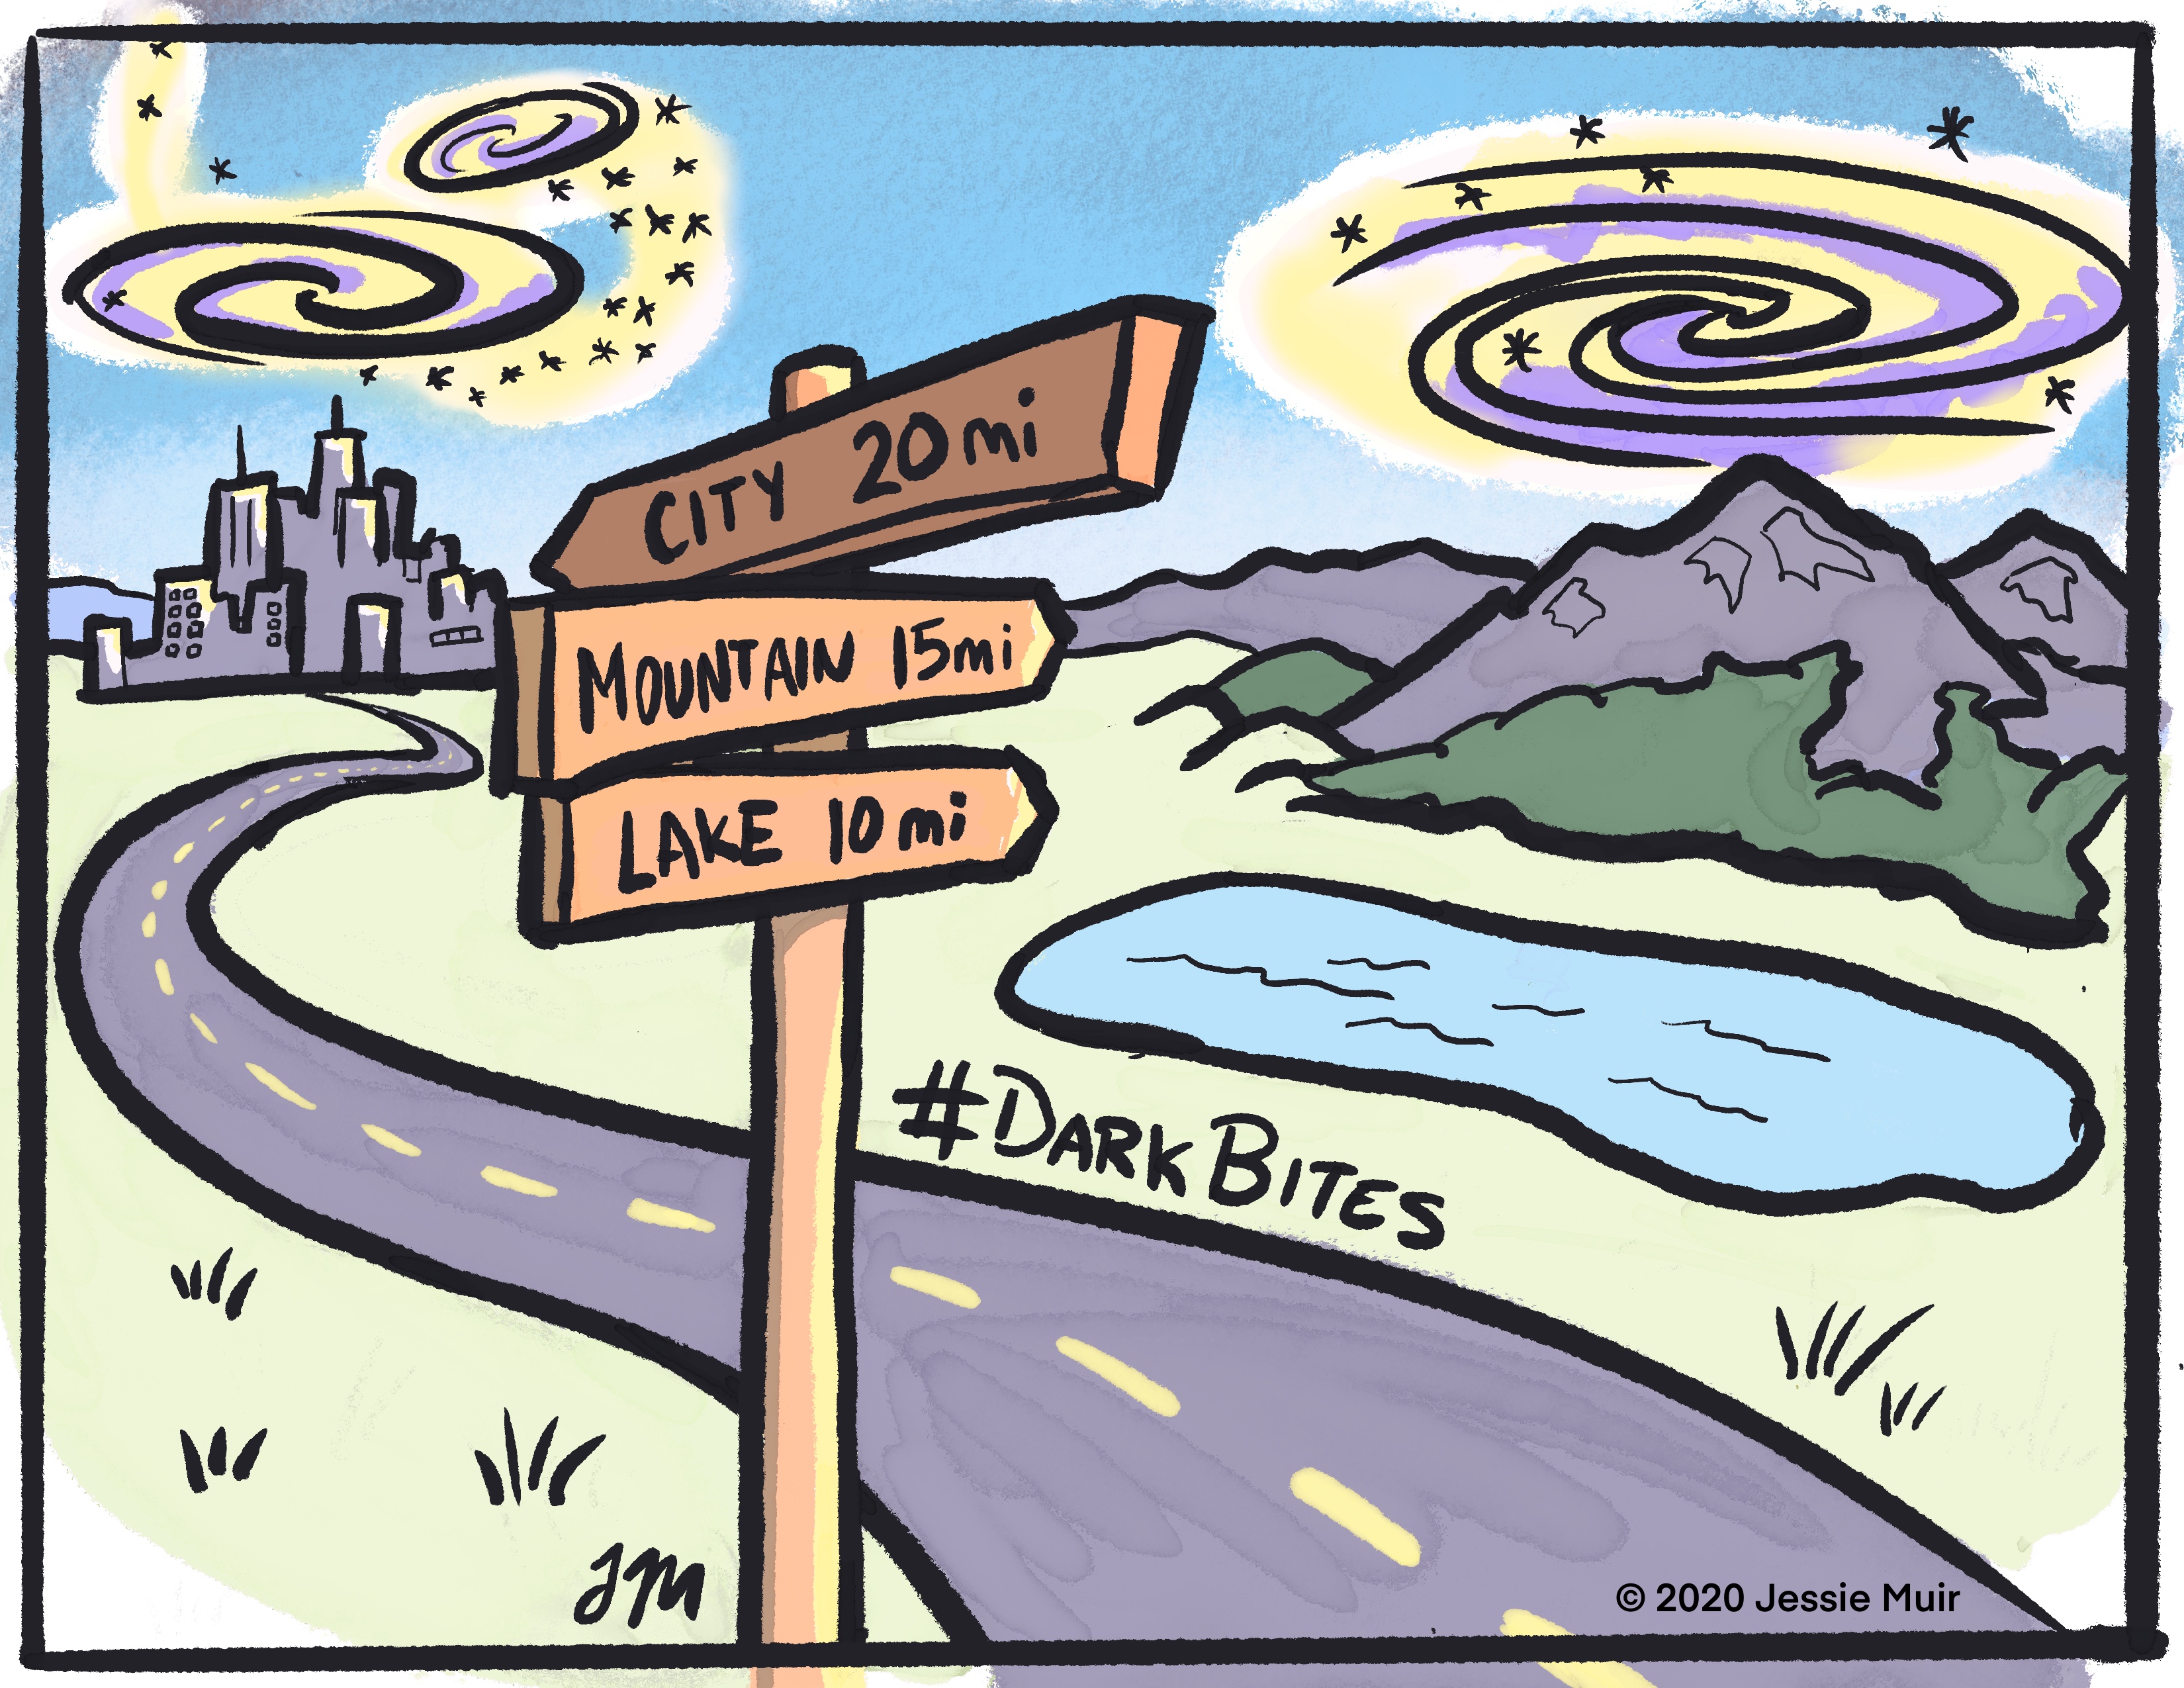
This cartoon is part of the DES Y3 #Darkbites social media series. It was drawn to illustrate a paper led by Joe DeRose, which describes simulations and simulated analyses used to validate the DES Y3 galaxy clustering and weak lensing analysis. The paper’s title is, “Dark Energy Survey Year 3...
[Read More]
See below for cartoons or other science-related artwork that I've made for talks or other outreach projects. Note that the thumbnails are distorted or don't all show the full image.
You're welcome to use any of these images for non-commercial purposes, but please credit me if you do. I can provide higher resolution versions of several of the images and individual frames of gifs upon request. For many of the digital illustrations, I'm also happy to provide versions with the image text in other languages, if given a translation and enough notice.
Darkbite on protecting against experimenter bias
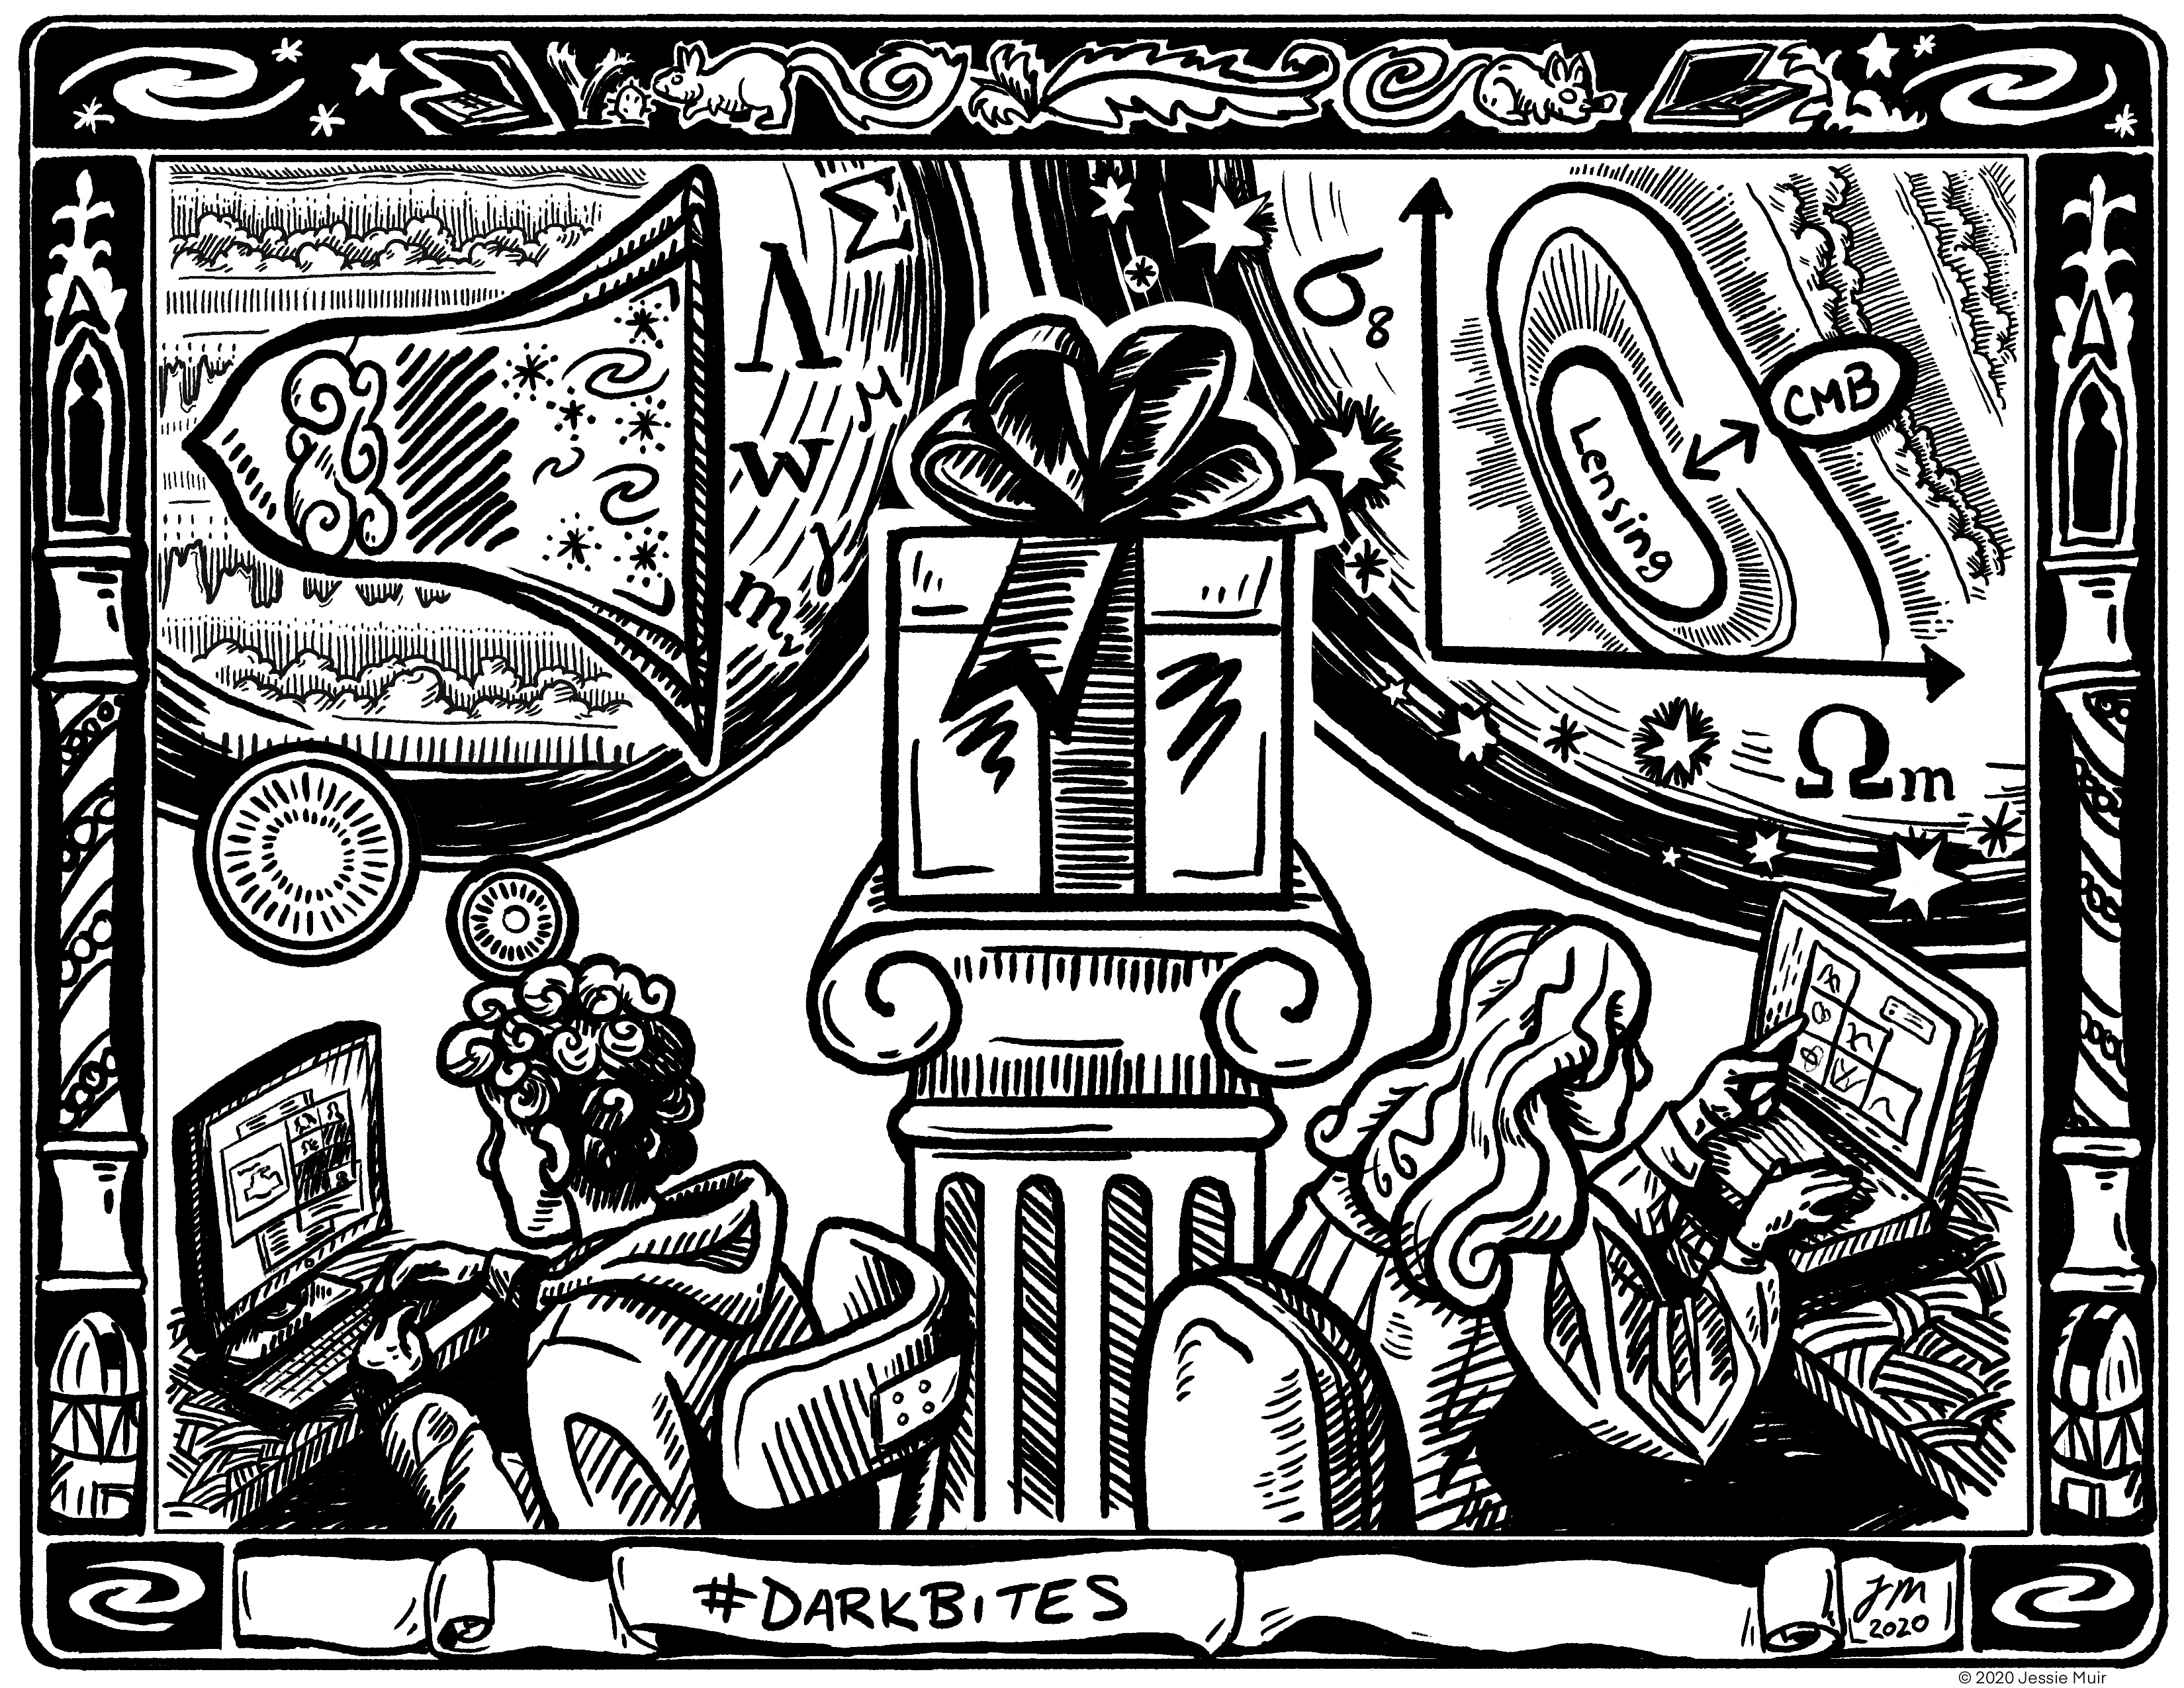
This cartoon is part of the DES Y3 #Darkbites social media series. It was drawn to illustrate a paper I led, which introduces and validates the method used to protect the DES Y3 galaxy clustering and weak lensing analysis against experimenter bias. The paper’s title is, “Blinding multi-probe cosmological experiments”...
[Read More]
Cosmological Tensions Darkbite
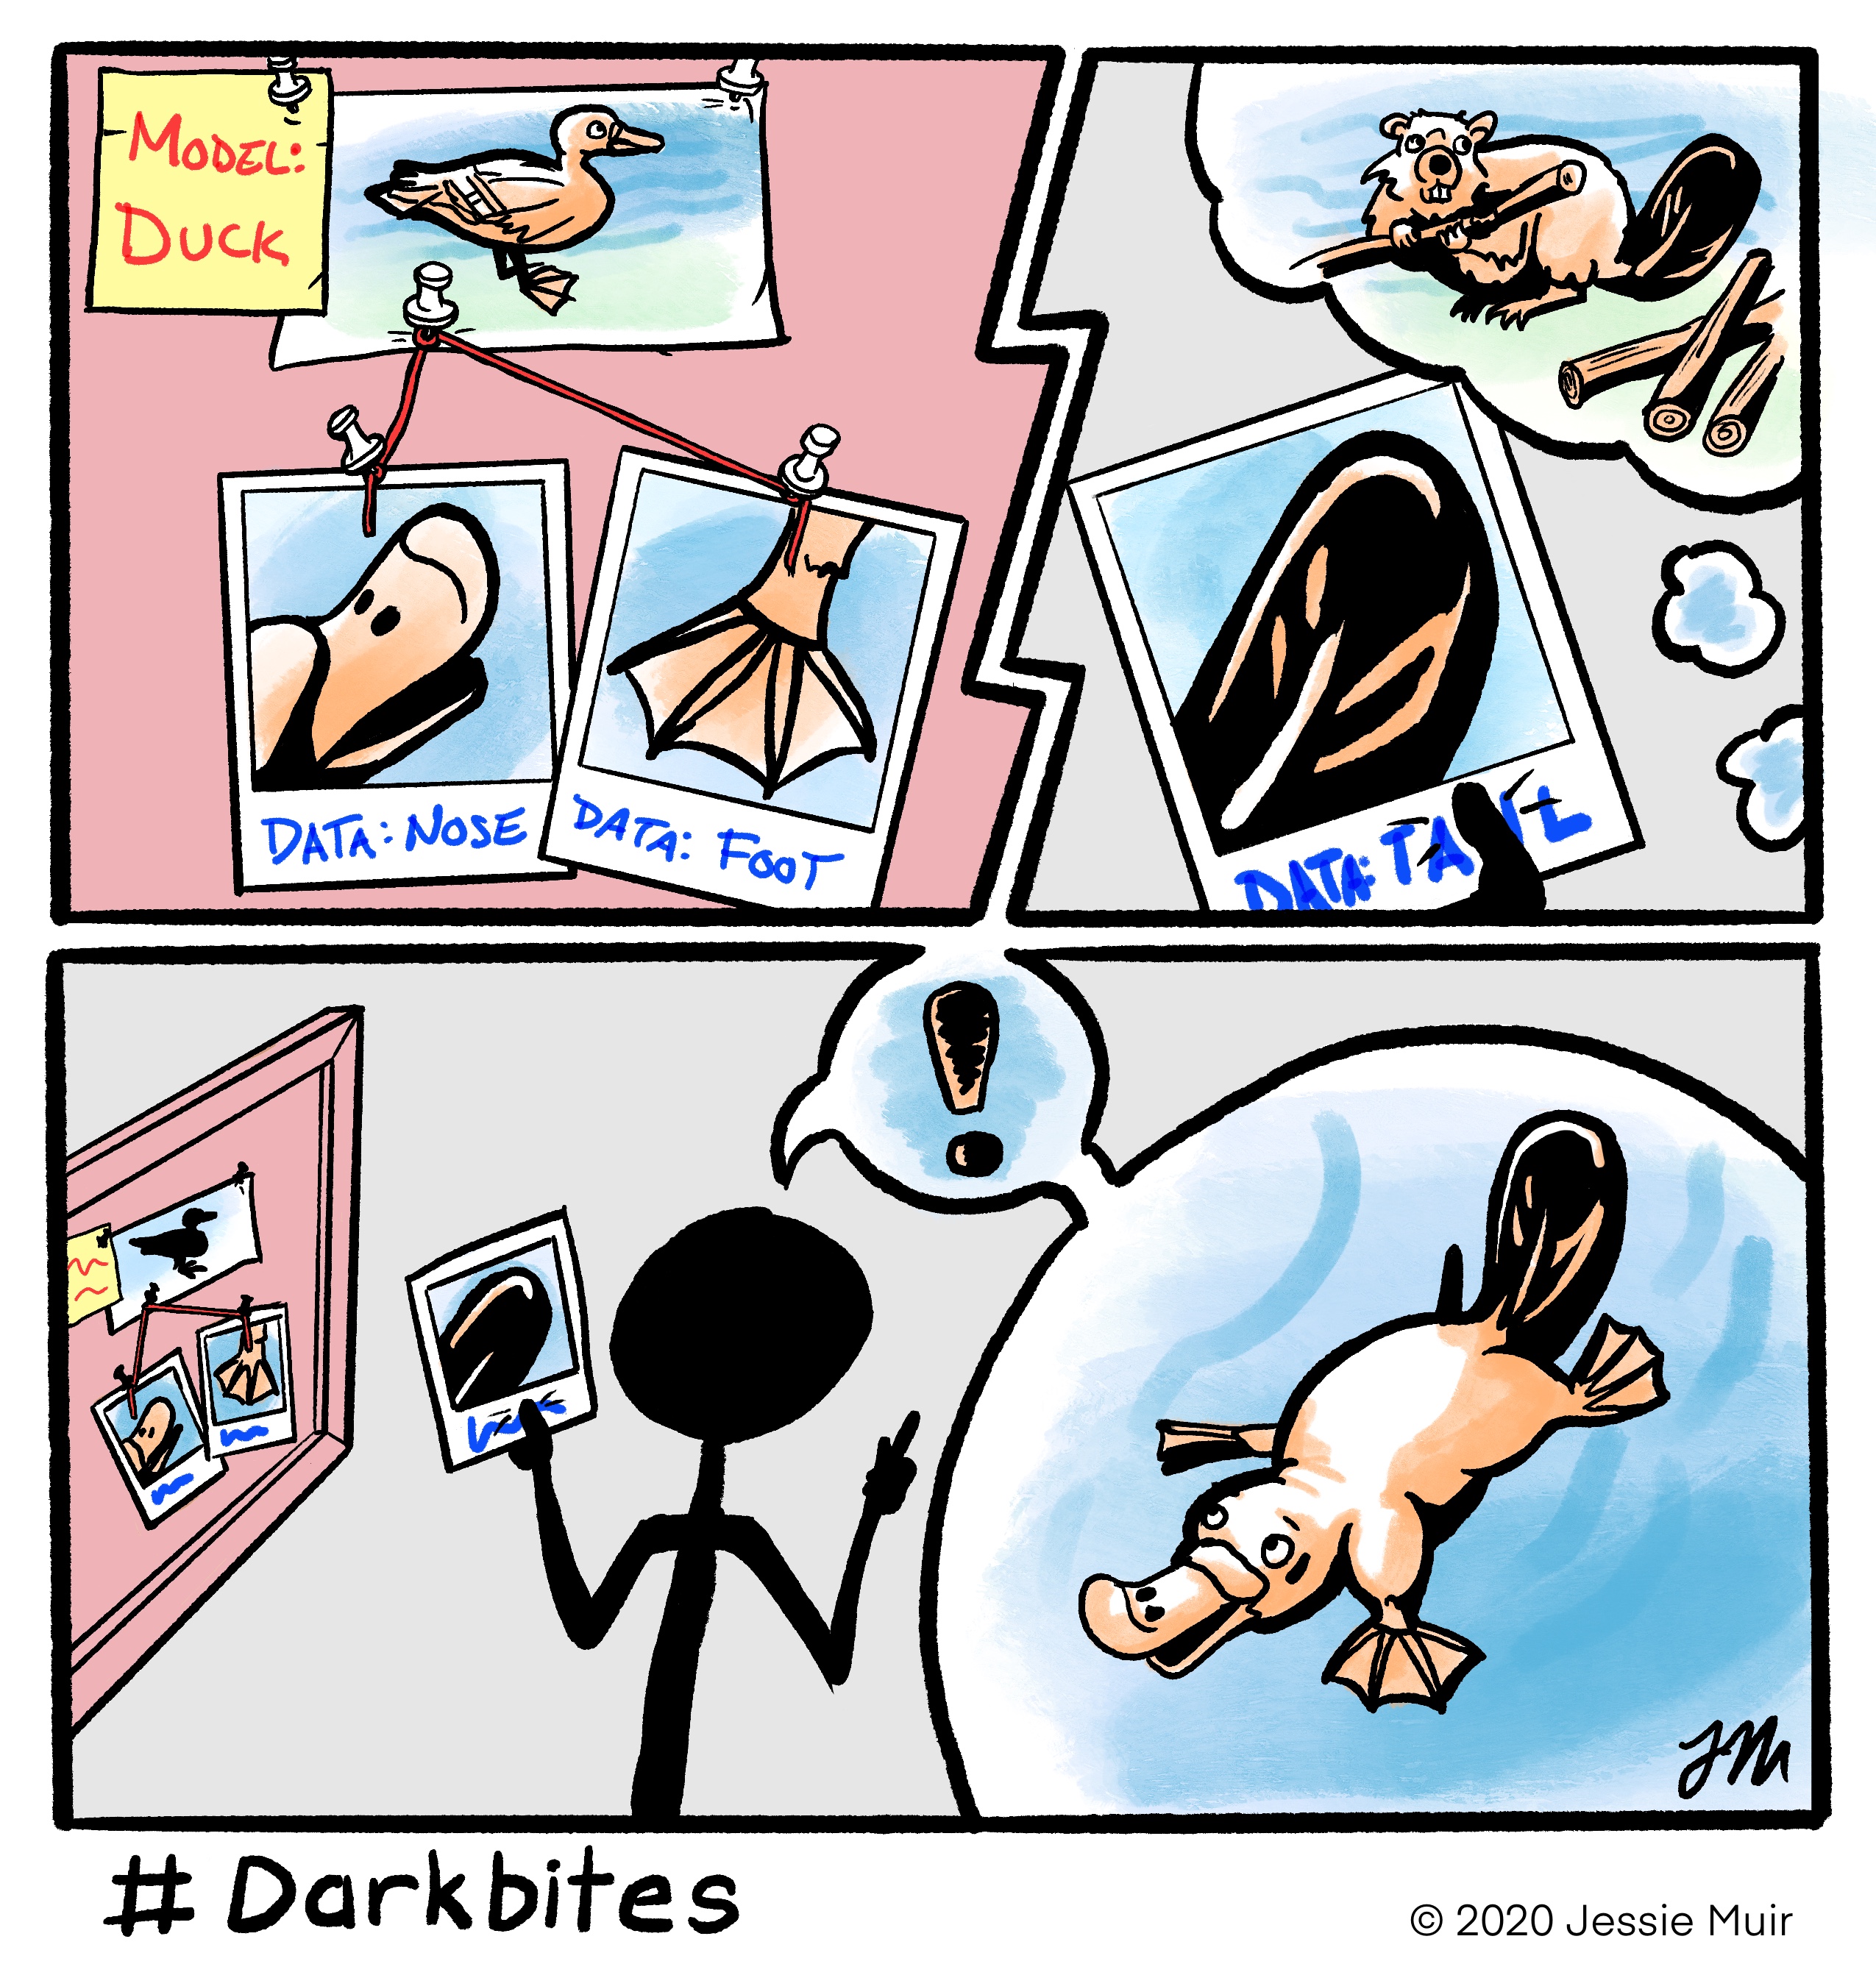
This cartoon is part of the DES Y3 #Darkbites social media series. It was drawn to illustrate a paper about the method used to check for tension between cosmological constraints made with different datasets. The paper was led by Pablo Lemos and Marco Raveri and is titled, “Assessing tension metrics...
[Read More]
Internal Tensions Darkbite
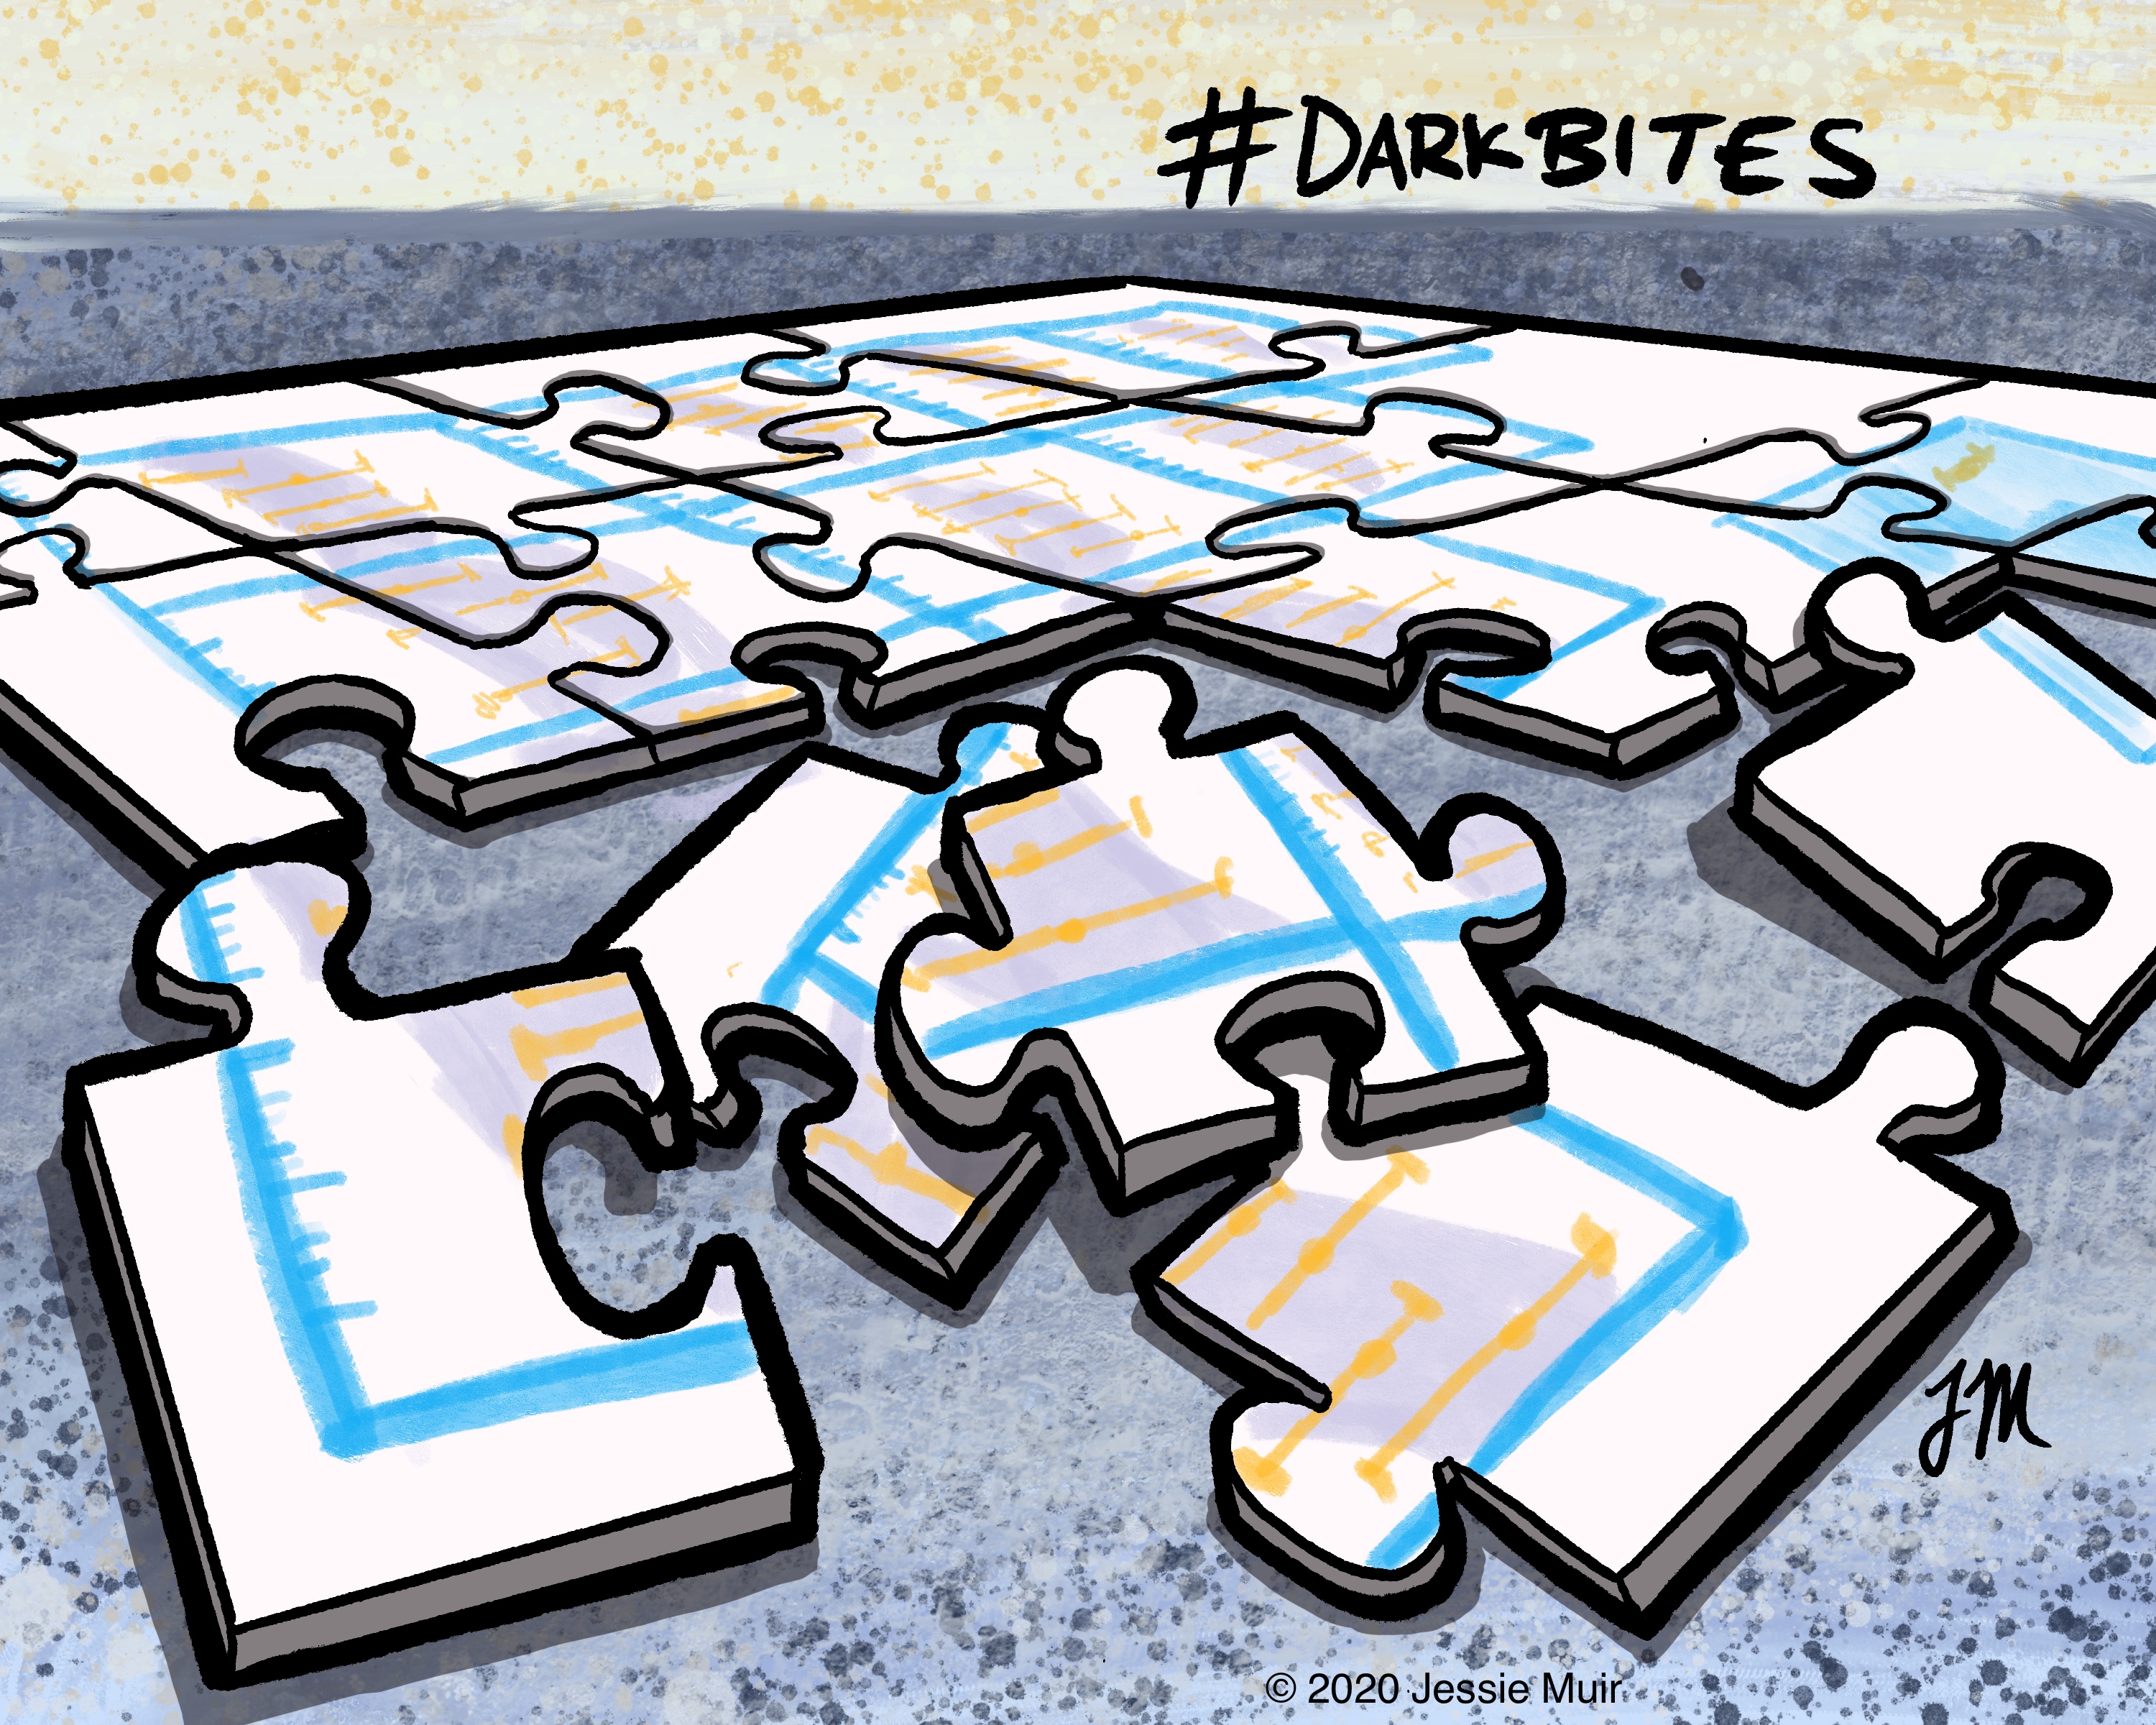
This cartoon is part of the DES Y3 #Darkbites social media series. It was drawn to illustrate a paper about the method used to check for internal agreement between different parts of the DES data. It was led by Cyrille Doux (website) and Eric Baxter (website) and is titled, “Dark...
[Read More]
Clustering redshifts Darkbite
This cartoon is part of the DES Y3 #Darkbites social media series. It was drawn to illustrate two papers describing how cross correlations with measurements from spectroscopic surveys were used to estimate the redshift distribution of DES galaxies.
[Read More]
