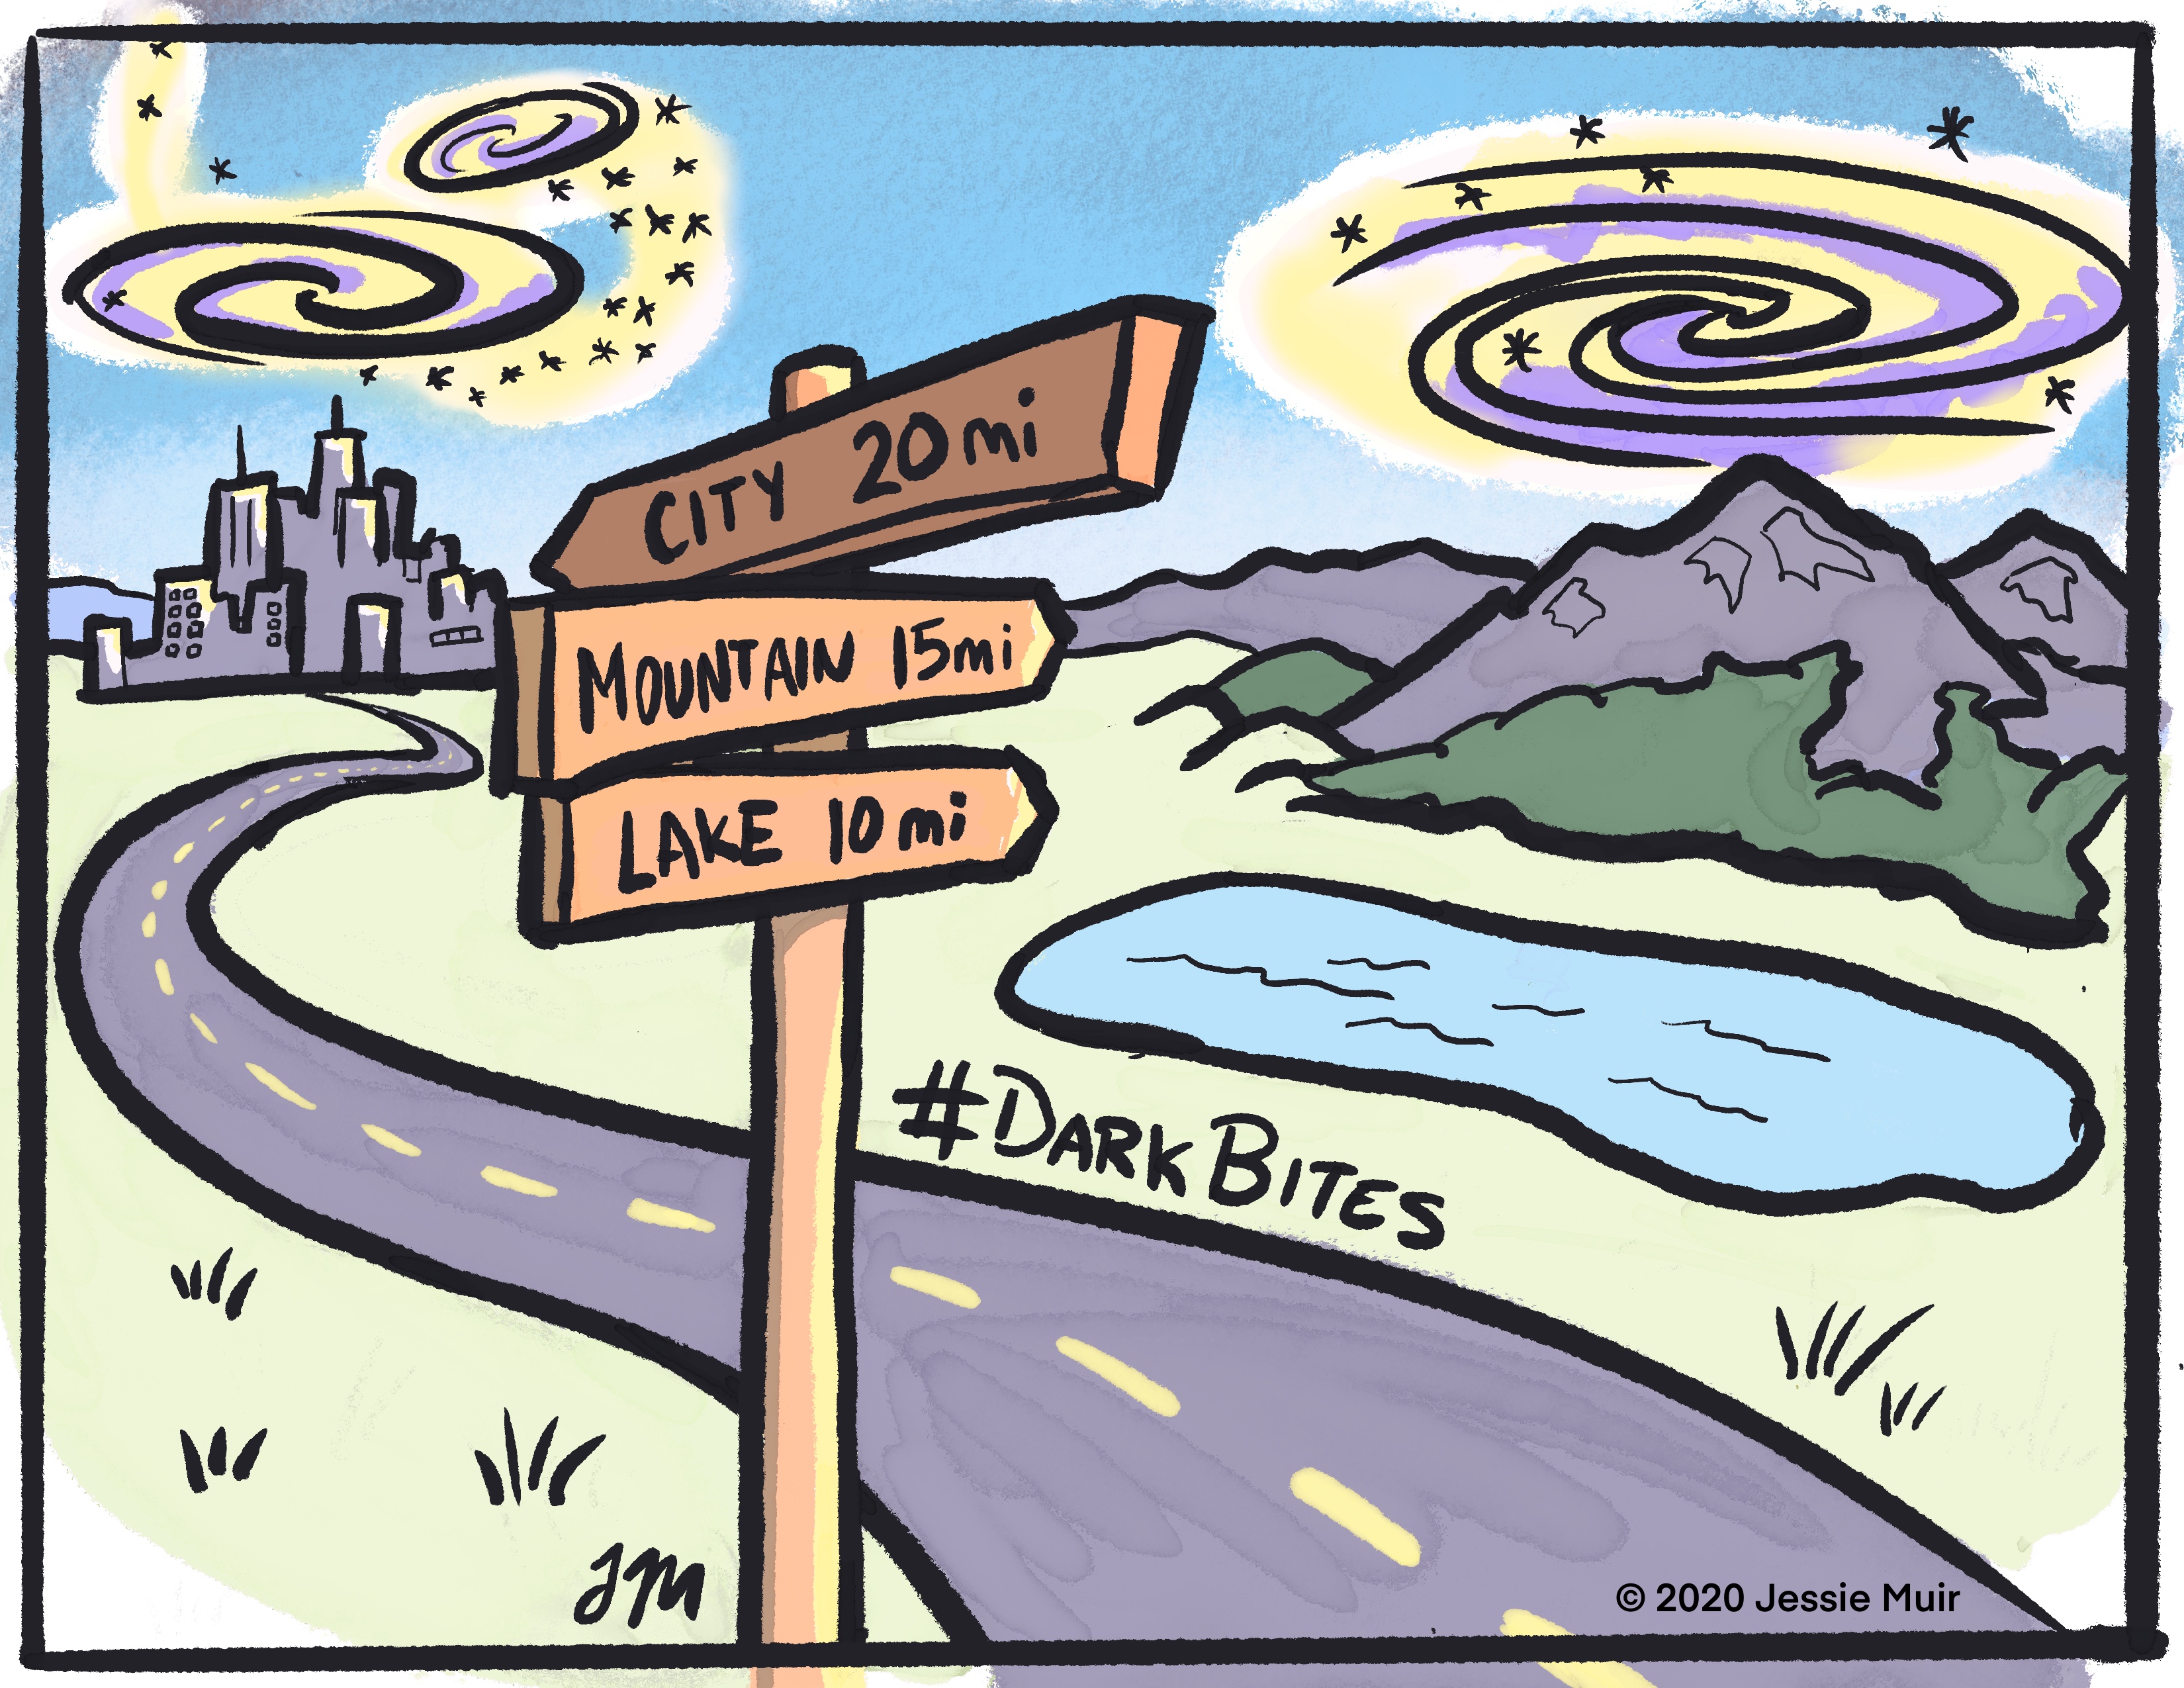
This cartoon is part of the DES Y3 #Darkbites social media series. It was drawn to illustrate two papers describing how cross correlations with measurements from spectroscopic surveys were used to estimate the redshift distribution of DES galaxies.

The paper doing this for the DES lens galaxy sample (which are used to measure galaxy positions) was led by Ross Cawthon (website), is titled “Dark Energy Survey Year 3 Results: Calibration of Lens Sample Redshift Distributions using Clustering Redshifts with BOSS/eBOSS.” (arXiv:2012.12826)
The paper applying the technique to DES source galaxies (the galaxies whose shapes are used to measure weak lensing shear) was led by Marco Gatti and Giulia Gianni (instagram). Its title is, “Dark Energy Survey Year 3 Results: Clustering Redshifts – Calibration of the Weak Lensing Source Redshift Distributions with redMaGiC and BOSS/eBOSS.” (arXiv:2012.08569)
The post’s associated text was:
Distances to galaxies tend to be difficult to figure out. In one technique used by DES, we estimate galaxy distances by their proximity to other galaxies that we do know the distance to. It’s similar to estimating the distance to a friend, by using nearby landmarks.
Here’s a link to the post. The twitter thread of the Y3 Darkbites posts begins here. The cartoons also being shared on the DES facebook and instagram pages.