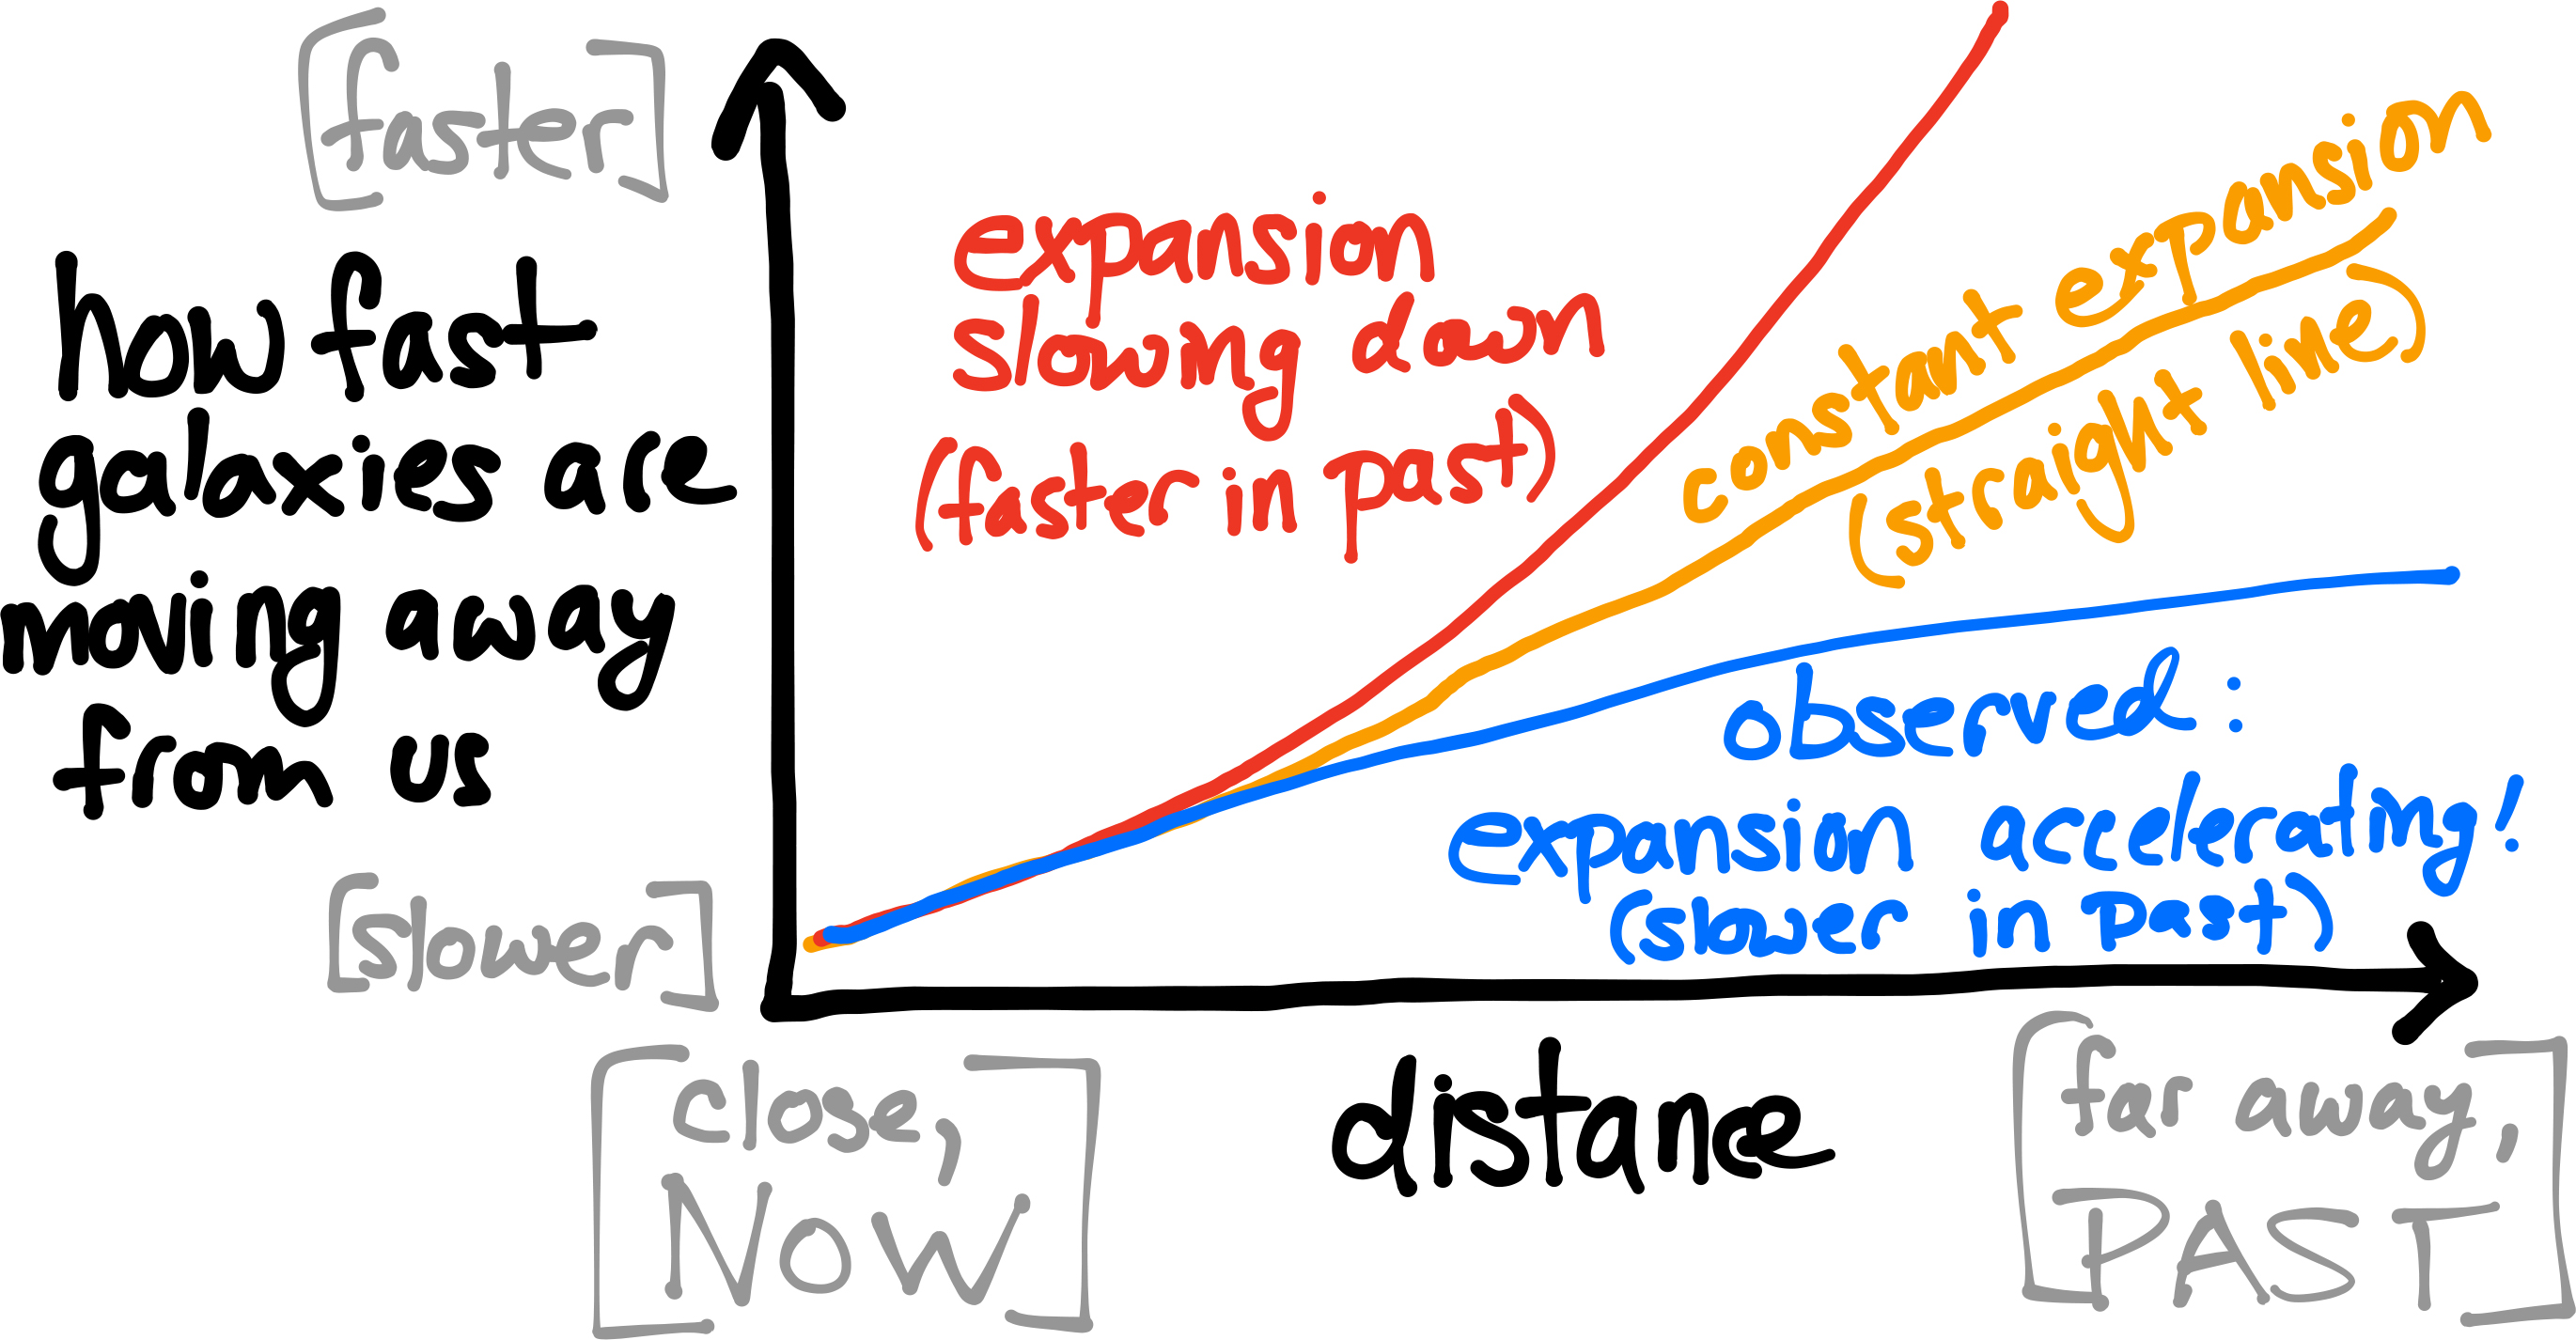
This hand-drawn plot was done to try and help develope more intuitive understanding of how type Ia supernovae can be used as standard candles to probe the expansion history of the Universe.
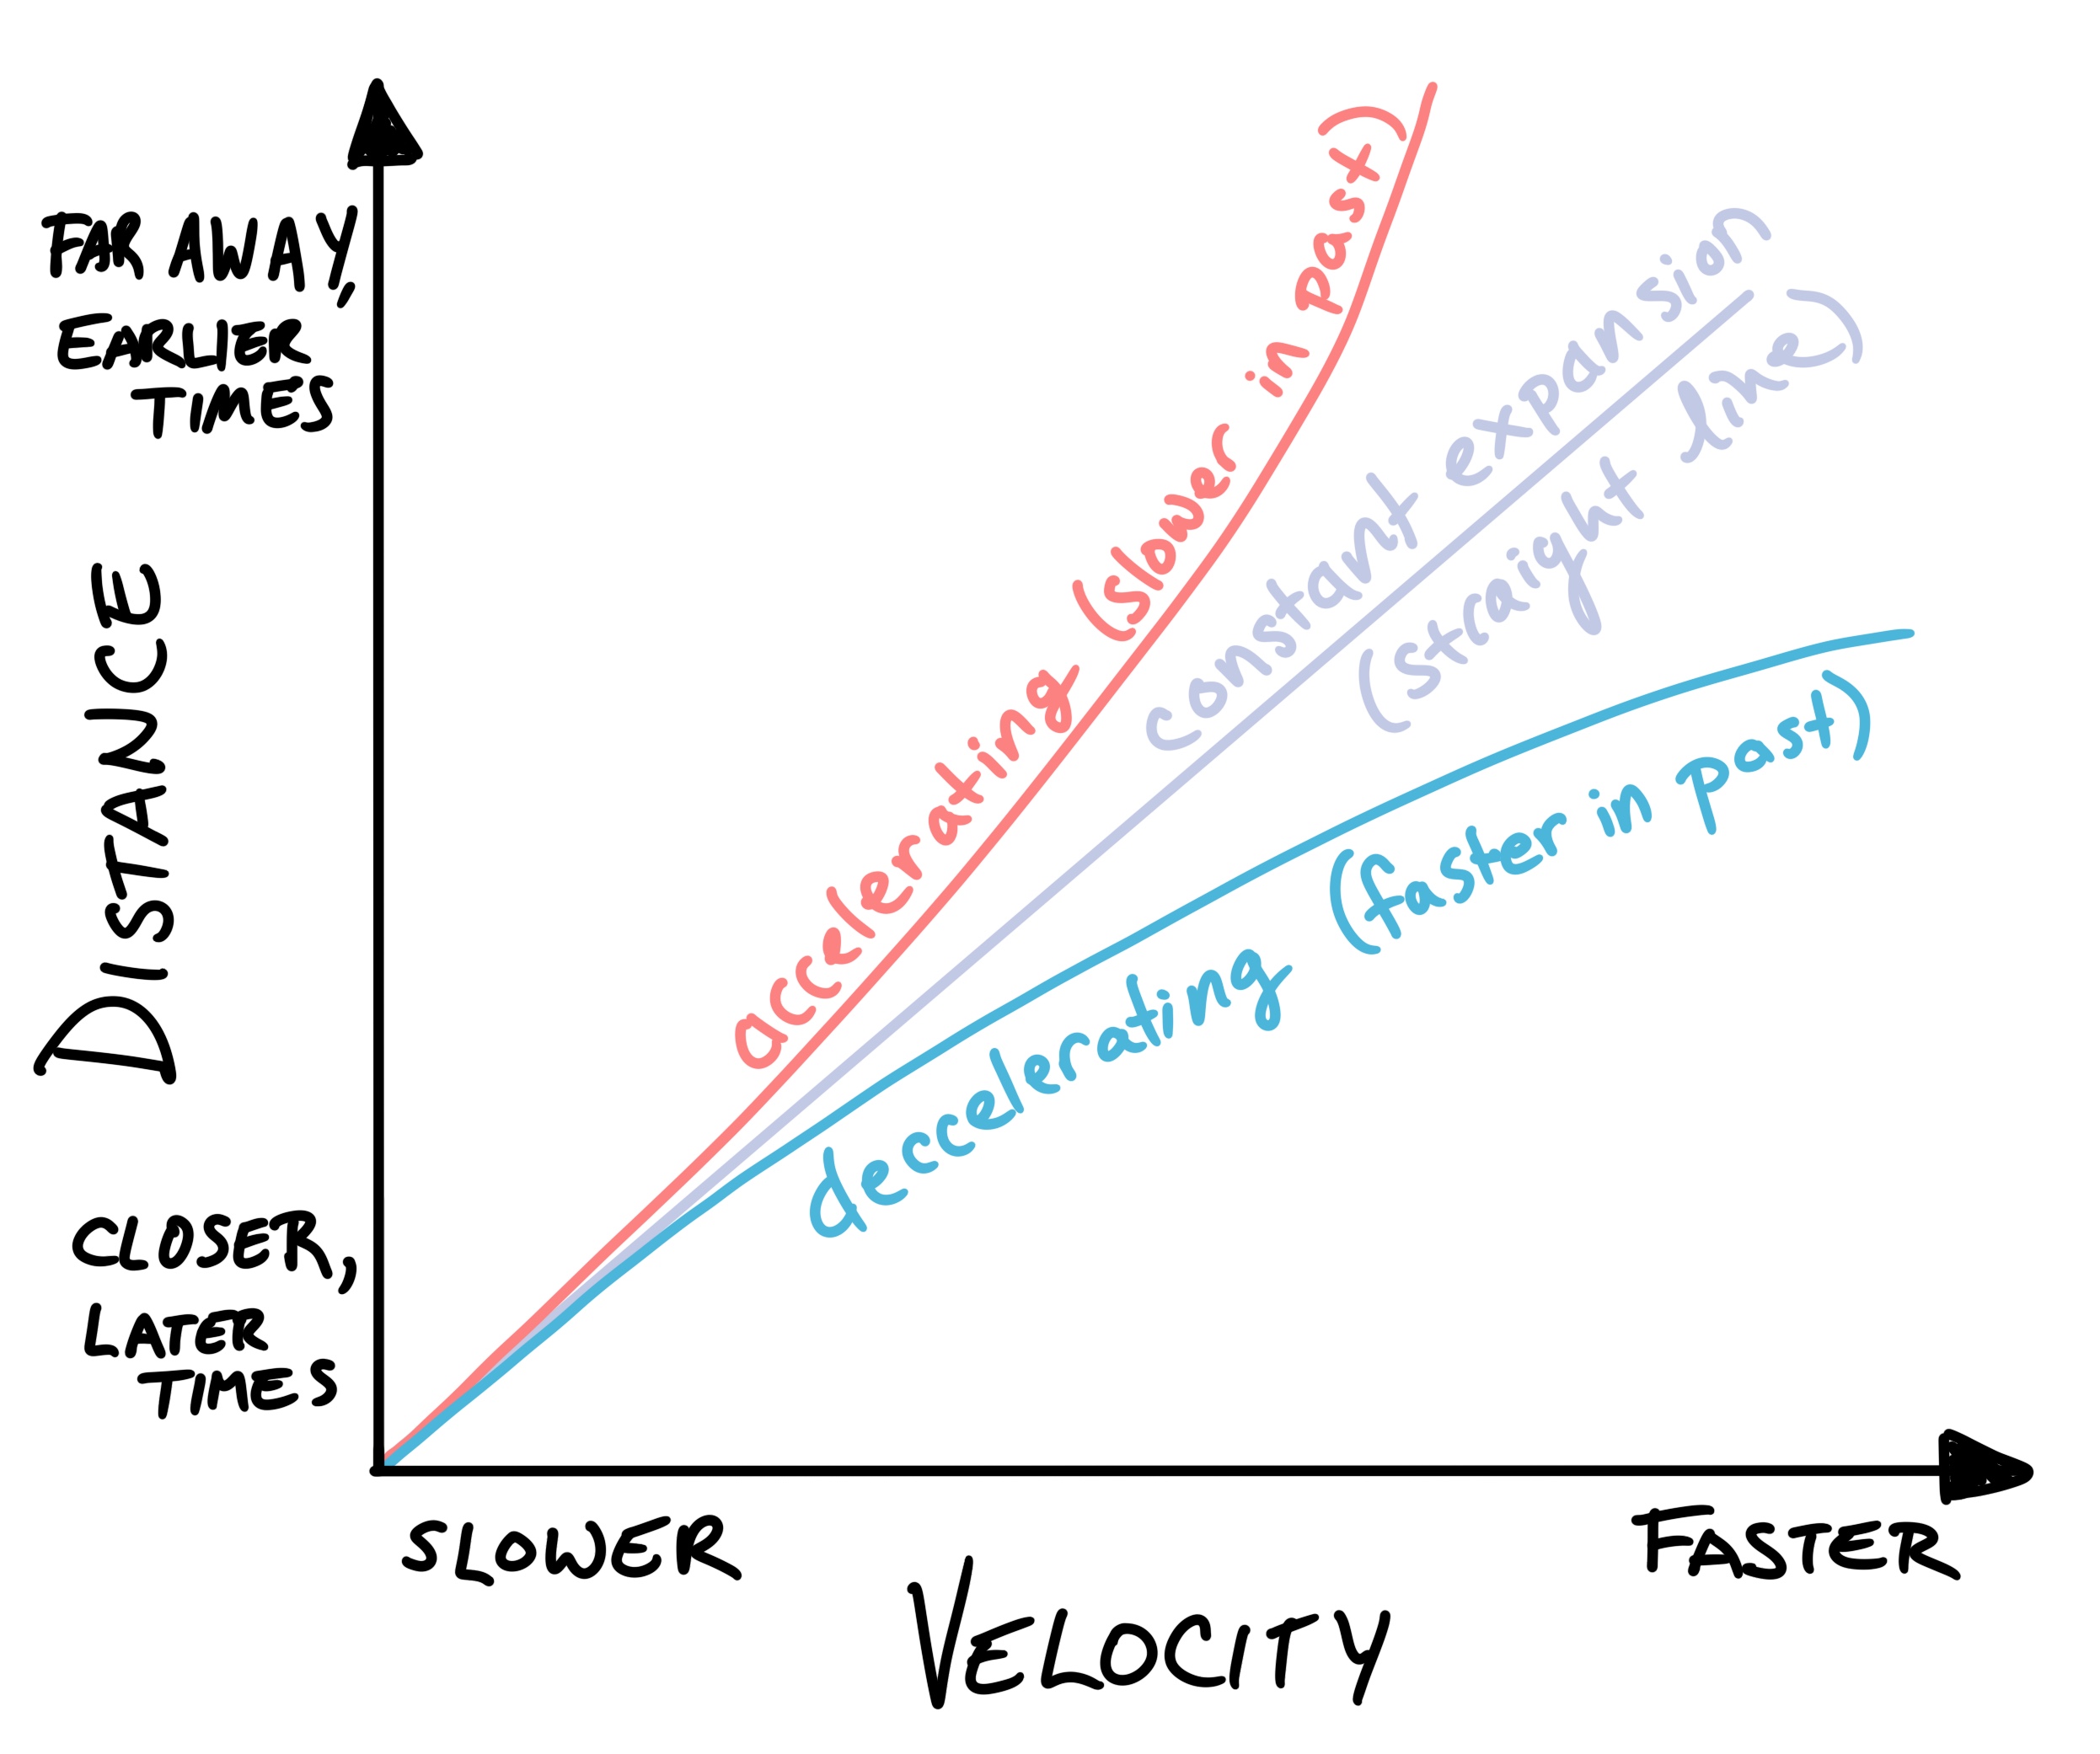
The above drawing is an updated versions of the older one below:
For either of these, images to add the lines to the plot one at a time are available upon request.